PostgreSQL Performance Optimization
PostgreSQL is a widely-used open-source relational database known for reliability and strong performance. Despite its robust design, PostgreSQL databases can experience slowdowns as data volumes increase and workloads become more demanding. Common causes of performance degradation include insufficient hardware resources, flawed database architecture such as missing indexes, and misconfigured settings that fail to align with actual usage patterns.
Preventing performance bottlenecks requires careful upfront planning of database structure and schema, combined with ongoing performance monitoring. This guide examines configuration adjustments and proven strategies that help PostgreSQL maximize CPU, memory, and disk utilization while maintaining efficient indexing, vacuuming, and query execution. It also addresses how to sustain performance as your database scales. The recommendations target system architects, database designers, and DevOps professionals working on new database projects or optimizing existing deployments.
The strategies outlined here will guide you in configuring and managing PostgreSQL for demanding workloads. Advanced architectural concepts like sharding, time-series optimization, and complex query planning fall outside this article's scope.
Establishing a Performance Baseline
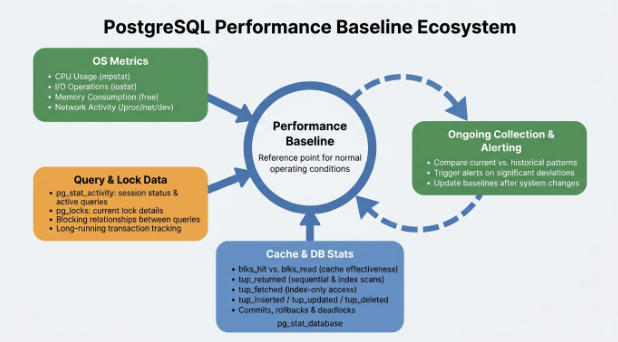
Before attempting to optimize an existing PostgreSQL database, documenting current performance metrics is essential. Creating a performance baseline provides a clear picture of normal operating conditions within your database environment. This reference point becomes invaluable for identifying performance regressions, confirming that optimizations actually improve performance, and establishing meaningful alert thresholds. You can store baseline data in flat files or directly within a database table for easier querying, analysis, and visualization.
Start by capturing operating system metrics including CPU usage, input/output operations, memory consumption, and network activity. On Linux systems, you can gather these metrics through shell scripts using utilities like mpstat for processor statistics, iostat for disk performance, the free command for memory usage, and reading network data from /proc/net/dev. Collecting these measurements at consistent intervals—such as every five seconds throughout a full day—reveals which hardware resources are being underutilized or pushed beyond capacity.
PostgreSQL-specific metrics come from built-in system tables like pg_stat_activity and pg_locks. The pg_stat_activity table shows the status and active queries for every database session, while pg_locks delivers comprehensive details about current database locks. Documenting which queries generate which types of locks, and which other queries those locks are blocking, offers critical insight into query interactions. This becomes particularly important in environments with long-running transactions, especially when applications manage transaction boundaries rather than delegating that responsibility to functions or stored procedures. Preserve this lock and query data alongside your operating system metrics to create a complete baseline picture.
PostgreSQL's internal caching and statistical data adds another valuable dimension to your baseline. The pg_stat_database system table reveals buffer cache effectiveness by comparing blocks read from cache versus disk (blks_hit versus blks_read), shows how many rows are retrieved through sequential and index scans (tup_returned), displays rows accessed exclusively through indexes (tup_fetched), indicates workload intensity through data modification counts (tup_inserted, tup_updated, tup_deleted), and tracks transaction outcomes including commits, rollbacks, and detected deadlocks.
After establishing your initial baseline, continue gathering these metrics regularly. This ongoing collection lets you compare current performance against historical patterns, trigger alerts when metrics deviate significantly from the baseline, and establish updated baselines following system modifications or upgrades.
Allocating Appropriate Hardware Resources
Selecting the right hardware for your PostgreSQL database begins with understanding the demands it will face in production environments. You need to estimate factors like concurrent user counts, expected query throughput, typical data volumes processed per query, transaction processing intensity, and anticipated peak usage periods. These estimates provide a foundation for determining CPU core counts, memory capacity, and storage performance requirements. However, initial estimates often miss the mark, making continuous monitoring and baseline comparisons critical for identifying resource gaps or excess capacity.
Insufficient CPU allocation forces concurrent queries to compete for processing time, causing severe performance degradation as queries take significantly longer to complete. Providing adequate CPU cores not only prevents this contention but also enables PostgreSQL to parallelize eligible queries across multiple cores. This parallelization capability becomes increasingly important as your user base grows and query complexity increases, ensuring the system maintains responsiveness under heavier loads.
Memory allocation in PostgreSQL serves multiple purposes and can be fine-tuned through various configuration parameters. PostgreSQL divides memory usage into several categories: shared memory that all database sessions can access, per-backend memory dedicated to individual connections and processes, operating system cache that exists outside PostgreSQL but significantly impacts performance, and memory used by background processes including autovacuum workers, the checkpointer, background writer, and parallel query workers that each maintain their own local memory allocations.
Determining adequate RAM cannot be based solely on database size projections. Memory requirements depend heavily on how applications actually access and manipulate data. If expanding memory later presents challenges—such as when running PostgreSQL on physical hardware rather than virtual infrastructure—consider allocating as much RAM as your budget allows upfront. Otherwise, start with a reasonable estimate based on your workload analysis and plan to add memory if monitoring reveals shortages. PostgreSQL can function with minimal memory allocations; the default configuration uses just 128 MB for shared buffers, though this is far below what production systems typically require.
The key to successful hardware provisioning lies in balancing initial estimates with flexibility for adjustment. Start with informed projections, establish performance baselines immediately after deployment, and continuously monitor resource utilization to identify when additional CPU cores, memory, or faster storage would deliver meaningful performance improvements.
Optimizing Configuration Parameters
PostgreSQL ships with conservative default configuration settings designed to work on minimal hardware, but these defaults rarely suit production workloads. Adjusting key configuration parameters to match your specific hardware capabilities and workload characteristics can dramatically improve database performance. The most impactful settings control how PostgreSQL allocates and uses memory, manages query execution, and leverages available CPU resources.
The shared_buffers parameter determines how much memory PostgreSQL dedicates to caching data blocks. This shared cache reduces disk I/O by keeping frequently accessed data in memory. For dedicated database servers, setting shared_buffers to 25-40% of total system RAM typically provides good results. Setting this value too high can be counterproductive, as it leaves insufficient memory for the operating system's file cache, which PostgreSQL also relies on heavily for performance.
The work_mem setting controls the amount of memory allocated for internal sort operations and hash tables before PostgreSQL resorts to writing temporary data to disk. Each complex query operation—such as sorting or joining—can use up to this amount of memory, and a single query might perform multiple such operations simultaneously. Setting work_mem too low forces excessive disk usage during query execution, while setting it too high risks memory exhaustion when many queries run concurrently. A starting point of 4-16 MB often works well, but this should be adjusted based on your typical query complexity and connection count.
The effective_cache_size parameter doesn't actually allocate memory but instead informs the query planner about how much memory is available for caching data across both PostgreSQL's shared buffers and the operating system cache. This helps the planner make better decisions about whether to use indexes or sequential scans. Setting this to 50-75% of total system RAM provides the planner with realistic expectations about cache availability.
PostgreSQL's parallel query capabilities can significantly accelerate certain operations by distributing work across multiple CPU cores. Parameters like max_parallel_workers_per_gather, max_parallel_workers, and max_worker_processes control how many processes PostgreSQL can use for parallel operations. Enabling parallelism and setting these values based on your available CPU cores allows PostgreSQL to execute eligible queries much faster, particularly for analytical workloads involving large table scans or aggregations.
Configuration tuning requires an iterative approach. Make incremental adjustments, measure the impact through your monitoring tools, and refine settings based on observed results rather than following generic recommendations blindly.
Conclusion
Achieving optimal Postgres performance tuning requires a comprehensive approach that addresses multiple aspects of database management. Postgres performance tuning is not a one-time effort but an ongoing process that demands attention to hardware provisioning, configuration optimization, and continuous monitoring. The strategies outlined in this guide provide a solid foundation for building and maintaining high-performance database systems capable of handling growing workloads and expanding datasets.
Starting with a performance baseline gives you the empirical data needed to make informed decisions and measure the effectiveness of your optimization efforts. Proper hardware allocation ensures your database has the CPU, memory, and storage resources necessary to handle concurrent users and complex queries without bottlenecks. Tuning configuration parameters like shared_buffers, work_mem, and parallelism settings aligns PostgreSQL's behavior with your specific workload patterns and available resources.
The most successful database implementations combine thoughtful upfront design with responsive ongoing management. Regular monitoring reveals emerging performance issues before they impact users, while periodic review of your baseline metrics helps identify trends and plan for future capacity needs. Whether you're architecting a new database application or optimizing an existing deployment, applying these best practices systematically will help you extract maximum performance from PostgreSQL.
Remember that every database workload is unique. Use these guidelines as a starting point, but always test changes in your specific environment and measure their impact. With careful attention to these fundamentals, you can build PostgreSQL systems that deliver consistent, reliable performance at scale.